A 14-month inquiry reveals extramarital affairs, concealment, and hard lessons for ministries.
Ministries serving seniors and supporting families facing Alzheimer’s, dementia, and the burdens of caregiving.
The California megachurch has also announced governance reforms.
Additions to an ongoing list of shows I've found nourishing — and why a diverse media diet matters for Christians
Plus, other notable ministry happenings from this week.
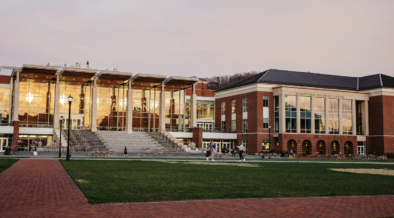
As small seminaries struggle, Biola and Phoenix Seminary chart a path forward.
From a suspected feigned illness to a car packed with shredded documents, the COVID-era case reads like a crime thriller.
After pandemic-era losses pushed the teen ministry into negative net worth territory, new leadership is focused on righting the ship.
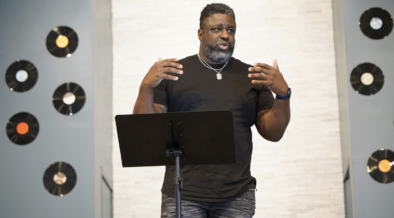
Hardwick was known for his disability advocacy and dynamic preaching.
Lawyers say the denomination's same-sex attraction recommendations risk more than a church split.
Plus, Ministry Brands, MinistryWatch database grows, ECAP and the SBC, and more.
The Southern Seminary president says recurring health episodes are manageable, not life-threatening.
Plus Orange begins third-party investigation, Pat Robertson’s death, and more.
A pastor's resignation over alleged mishandling of church funds set off a year of upheaval — and a congregation still waiting for accountability.
Ministries stepping into the gaps that open when school is out.
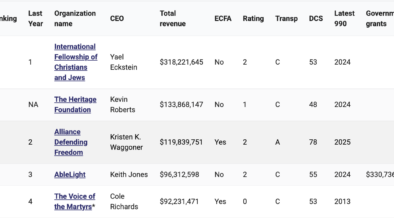
The International Fellowship of Christians and Jews is once again at the top of the list.
Son of former president Jerry Falwell Jr. sues over broken employment contract.
Fault lines are becoming fissures, and a cultural earthquake may be in our future
More than 20 medical specialists will man the field hospital in Democratic Republic of the Congo.
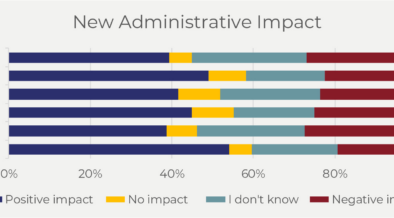
Optimism about the administration's impact on Christian work has dropped — even as most ministries report revenue growth and rising AI adoption.