Plus, other notable ministry happenings from this week.
Rev. Locke told churchgoers federal agents searched home for hours after receiving reports of alleged financial misconduct.
Leading the Way's ECFA exit leaves donors without key financial accountability and transparency measures
Tommie Zito plans to use the former Green Mountain College site for ‘Z University.’
Plus, the Evangelical-Catholic movement, support for Israel, John Calvin
Edwin Brant Frost IV’s Christian reputation helped him solicit more than $140 million from investors.
Pastor accused of international child abduction must surrender 5-year-old girl to mother.
Plus, New York Theological Seminary closes, Christian ministries in India targeted, and more.
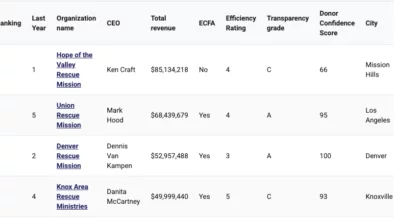
The database includes 166 rescue mission ministries with $1.98 billion in total revenue.
Ministries helping people develop job skills, confidence, and Christ-centered character from Ohio to Brazil.
Richard Reinaldo Garcia was indicted for fraud in church flipping and Christian concert schemes.
His life was an example, and a challenge, to those of us left behind
Judge converts case to Chapter 7, sidelining McGraw and Peteski Productions.
The Christian AI company predicts it will turn a profit by end of 2026—but are investors buying it?
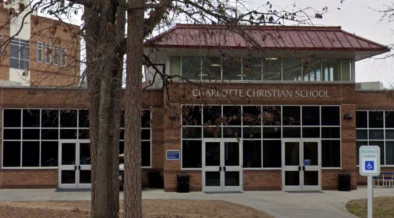
The K-12 school’s financial efficiency climbs, but transparency gaps remain a concern for donors.
Plus, building trust, He Gets Us, remembering Robert Sloan
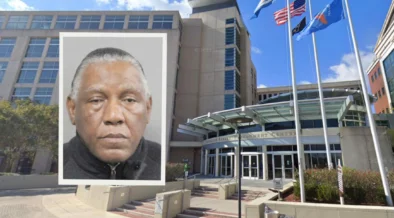
Case highlights need for churches to screen leaders and enforce child-safety policies.
Plus, Bill Hwang found guilty, and Matt Redman describes mistreatment at hands of former pastor.